Just click the button below and provide your details – our team will promptly reach out to schedule your one-on-one session.
Our experts are standing by to discuss your needs, answer your questions, and show you how DataOps IT can help you accelerate growth, improve efficiency, and stay ahead of the competition.
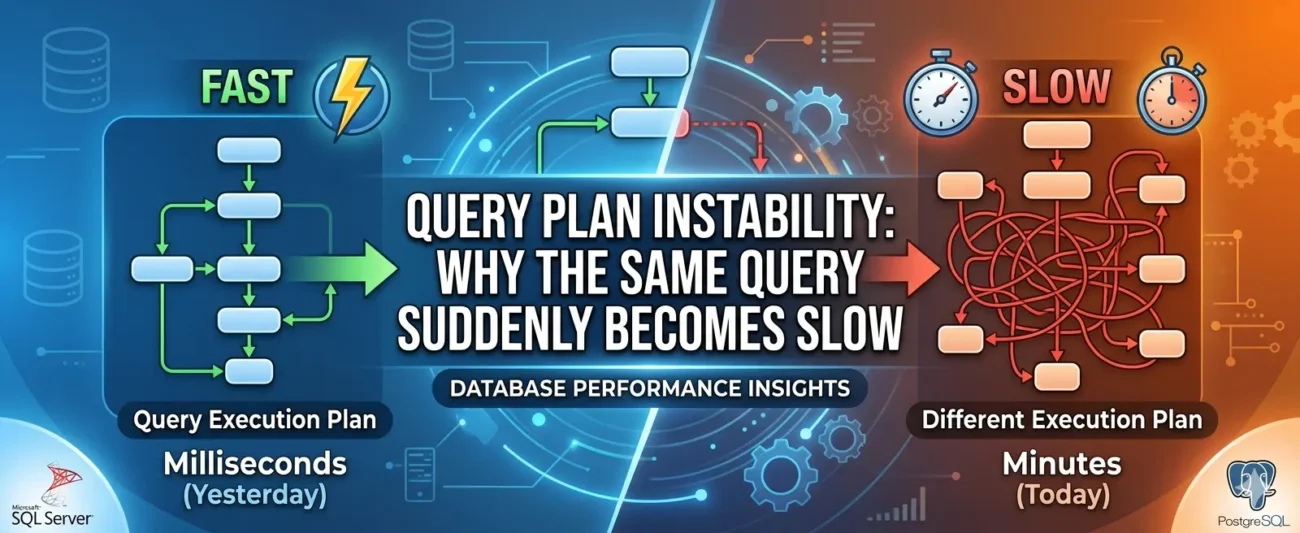
Everything was fine on Monday morning. By Tuesday afternoon, a query that had been running in under a second was taking four minutes — and nobody had touched the code. Sound familiar? Welcome to one of the most maddening phenomena in database engineering: query plan instability.
It arrives without warning. A report that users rely on daily suddenly hangs. An API endpoint that normally responds in milliseconds begins timing out. The application hasn’t changed. The schema hasn’t changed. And yet something, clearly, has changed — invisibly, silently, deep inside the database engine. The culprit, more often than not, is a shift in the query execution plan: the internal roadmap the database optimiser chose to execute your SQL. Understanding why those plans shift — and why they occasionally choose a catastrophically bad route — is one of the most valuable skills a DBA or backend engineer can develop.
This article walks through what query plan instability is, the conditions that provoke it, how to diagnose it methodically, and what you can do to defend your database against it. We draw examples primarily from SQL Server and PostgreSQL, though the underlying concepts apply across virtually every relational database system.
What Is a Query Execution Plan, Exactly?
Before we can understand instability, we need to understand what a query execution plan actually is. When you send a SQL statement to a relational database, the engine does not immediately go and fetch rows. Instead, it hands the query to a component called the query optimiser, which analyses the statement and devises a strategy for executing it efficiently.
That strategy — the execution plan — answers questions such as: Should we scan the entire table, or use an index? If we are joining two tables, should we use a nested loop, a hash join, or a merge join? In what order should we apply filters? The optimiser considers dozens of possible plans and estimates the cost of each, then selects the one it believes will be cheapest.
The critical word there is estimates. The optimiser is not clairvoyant. It relies on statistics — summaries of the data distribution stored in system tables — to make its guesses. When those statistics accurately reflect reality, the estimates are good, the plan chosen is sensible, and everything runs smoothly. When they diverge from reality, the optimiser can make grievously wrong choices, and a plan that looks cheap on paper turns out to be extraordinarily expensive in practice.
“The optimiser is not clairvoyant. It relies on statistics to make its guesses — and when those statistics diverge from reality, even a simple query can grind a production system to a halt.”
The Anatomy of a Plan Change
A query execution plan is not fixed for all time. The database will regenerate it whenever certain conditions are met. Understanding those conditions is the first step toward diagnosing instability.
1. Statistics Updates
Most databases update column and index statistics either automatically (on a schedule or when a threshold of row changes is reached) or manually via a command like UPDATE STATISTICS or ANALYZE. When statistics are refreshed, the optimiser sees a new picture of the data and may choose an entirely different plan.
In SQL Server, the automatic update threshold is famously coarse: for tables larger than 500 rows, statistics are updated when roughly 20% of rows change. On a table with ten million rows, that is two million modifications before a refresh is triggered. In the meantime, the optimiser is navigating with an outdated map.
PostgreSQL’s autovacuum process runs ANALYZE based on similar thresholds, configurable via autovacuum_analyze_scale_factor and autovacuum_analyze_threshold. The defaults are generous enough that heavily-written tables can accumulate significant statistical drift before a refresh kicks in.
2. Parameter Sniffing
Parameter sniffing — or parameter sensitivity, as PostgreSQL users tend to call it — is one of the most common causes of sudden, inexplicable slowdowns. It occurs when a database caches a plan that was optimised for one particular set of parameter values and then reuses that plan for a very different set of values.
Consider a stored procedure that searches an orders table by customer ID. The first execution uses the ID of a small account with three orders. The optimiser, seeing three rows, chooses an index seek — perfectly sensible. The plan is cached. The next execution uses the ID of a large enterprise account with 800,000 orders. The cached plan still uses the index seek, which is now catastrophically inefficient compared to a table scan. The procedure that used to return results in 80 milliseconds now takes six minutes.
sql
— SQL Server: a classic parameter sniffing scenario
CREATE PROCEDURE GetOrdersByCustomer
@CustomerId INT
AS
SELECT OrderId, OrderDate, TotalAmount
FROM Orders
WHERE CustomerId = @CustomerId;
GO
— First call: sniffed for CustomerId = 42 (3 rows)
EXEC GetOrdersByCustomer @CustomerId = 42;
— Second call: same cached plan, but CustomerId = 1 has 800,000 rows
EXEC GetOrdersByCustomer @CustomerId = 1; — potentially very slow
3. Plan Cache Eviction
Query plans are stored in a plan cache (the procedure cache in SQL Server; the shared buffer pool in PostgreSQL). When memory pressure rises — due to other workloads, large sorts, or bulk operations — the database may evict cached plans to free memory. The next time the query runs, a fresh plan must be compiled, and this time the optimiser may arrive at a different conclusion based on the current state of statistics.
4. Recompilation Triggers
Certain events force SQL Server to recompile a plan explicitly: schema changes, changes to SET options within a session, DROP and re-CREATE of tables, and explicit calls to sp_recompile. Even creating a new index on a table can invalidate cached plans for queries that touch it — which is worth bearing in mind when you deploy index changes to production.
5. Version Upgrades and Patch Releases
Database engine updates often include changes to the query optimiser itself — improved cardinality estimator models, new join algorithms, altered cost thresholds. An upgrade that was tested on a development server can produce plan regressions in production, particularly if the data volumes differ substantially between environments. This is an underappreciated source of instability that bites teams during routine maintenance windows.
Key Insight: SQL Server 2014 introduced a new cardinality estimator (CE 120) that changed how row counts are estimated for joins and filters. Many organisations upgrading from SQL Server 2012 experienced immediate plan regressions — queries that had been stable for years suddenly chose poor plans. The fix was often to pin the compatibility level to the previous CE model whilst investigating individual regressions.
Recognising the Symptoms
Query plan instability rarely announces itself cleanly. Instead, it tends to masquerade as application slowness, timeout errors, or generalised “the database is struggling” complaints. Here are the patterns that should raise your suspicion:
Intermittent slowness for the same query: It runs fine most of the time, then occasionally becomes extremely slow for a period, then recovers. This is classic parameter sniffing — different parameter values are triggering different plans.
Slowness that appeared after a maintenance window: Statistics updates, index rebuilds, or database upgrades all force plan recompilation. If slowness began the morning after a maintenance job, a plan regression is highly likely.
Slowness tied to data volume milestones: The query was fine with one million rows and became slow after the table grew to ten million. The statistics crossed a threshold and triggered a plan update.
Slowness that resolves after a procedure cache clear: If running DBCC FREEPROCCACHE in SQL Server (or forcing a re-plan in PostgreSQL) temporarily resolves the issue, a bad cached plan is almost certainly involved.
Diagnosing a Plan Regression
Diagnosis requires evidence. The good news is that modern database engines provide rich tooling for capturing and comparing execution plans. Here is a methodical approach.
Step 1: Capture the Actual Execution Plan
In SQL Server, enable SET STATISTICS IO ON and SET STATISTICS TIME ON alongside the actual execution plan to see both the plan chosen and the physical reads it generated. In SSMS, use Ctrl+M to include the actual plan. In PostgreSQL, EXPLAIN (ANALYZE, BUFFERS) is your equivalent.
sql
— PostgreSQL: full diagnostic output
EXPLAIN (ANALYZE, BUFFERS, FORMAT TEXT)
SELECT o.OrderId, o.OrderDate, c.CompanyName
FROM Orders o
JOIN Customers c ON o.CustomerId = c.CustomerId
WHERE o.OrderDate >= ‘2024-01-01’
AND o.Status = ‘Pending’;
Step 2: Compare Estimated vs Actual Rows
The single most revealing signal in an execution plan is the gap between estimated rows and actual rows. When the optimiser estimates 120 rows but 4.2 million rows are actually processed, something has gone very wrong with its data model. Look for operators where the estimate is off by an order of magnitude or more — those are the points where the plan is likely to be suboptimal.
Step 3: Check Statistics Age and Sampling Rates
In SQL Server, query sys.dm_db_stats_properties to see when statistics were last updated and what sampling rate was used. Very large tables are often sampled at a fraction of a percent, which can produce wildly inaccurate histograms for skewed distributions.
sql
— SQL Server: check statistics freshness
SELECT
s.name AS StatisticName,
sp.last_updated,
sp.rows,
sp.rows_sampled,
CAST(sp.rows_sampled * 100.0 / NULLIF(sp.rows, 0) AS DECIMAL(5,2)) AS SamplePct,
Step 4: Use the Query Store (SQL Server 2016+ / PostgreSQL 14+)
The Query Store is a game-changer for diagnosing plan regressions. It records historical execution plans alongside their runtime metrics, allowing you to see exactly when a plan changed and compare the performance of multiple plans for the same query. In SQL Server Management Studio, the “Regressed Queries” report surfaces plan regressions automatically. In PostgreSQL 14+, the pg_stat_statements extension combined with pg_store_plans provides similar visibility.
sql
— SQL Server: find queries with multiple plans and large variance
SELECT TOP 20
qsq.query_id,
qsq.query_hash,
COUNT(DISTINCT qsp.plan_id) AS PlanCount,
MAX(qsrs.avg_duration) / 1000.0 AS MaxAvgDurationMs,
MIN(qsrs.avg_duration) / 1000.0 AS MinAvgDurationMs
FROM sys.query_store_query qsq
JOIN sys.query_store_plan qsp ON qsq.query_id = qsp.query_id
JOIN sys.query_store_runtime_stats qsrs ON qsp.plan_id = qsrs.plan_id
GROUP BY qsq.query_id, qsq.query_hash
HAVING COUNT(DISTINCT qsp.plan_id) > 1
ORDER BY MAX(qsrs.avg_duration) DESC;
The Remedies: Stabilising Your Query Plans
Once you have identified a plan regression, you have several tools at your disposal. The right choice depends on the root cause, the urgency of the situation, and how much control you have over the application code.
Update Statistics with a Higher Sampling Rate
The quickest fix for statistics-related regressions is to update statistics manually with a fullscan or a high sampling rate. This gives the optimiser a more accurate picture of the data distribution and often resolves the issue immediately.
sql
— SQL Server: full scan update
UPDATE STATISTICS dbo.Orders WITH FULLSCAN;
— PostgreSQL: manual analyze
ANALYZE orders;
— For specific columns in PostgreSQL
ALTER TABLE orders ALTER COLUMN customer_id SET STATISTICS 500;
ANALYZE orders (customer_id);
Force a Plan with Query Store (SQL Server)
If you know which plan performs well, you can force the Query Store to use it regardless of what the optimiser would otherwise choose. This is the safest, most sustainable approach for production systems — it does not require code changes and can be reverted instantly.
sql
— Force a specific plan in SQL Server Query Store
EXEC sys.sp_query_store_force_plan
@query_id = 42, — from sys.query_store_query
@plan_id = 7; — the known-good plan
Rewrite with OPTION Hints (SQL Server)
Query hints give you direct control over how the optimiser behaves. They should be used sparingly — they override the optimiser’s judgement permanently and can become liabilities as data patterns change — but they are invaluable when you need a quick, reliable fix.
sql
— Optimise for a specific parameter value
SELECT * FROM Orders WHERE CustomerId = @Id
OPTION (OPTIMIZE FOR (@Id = 1));
— Optimise for an unknown value (uses average statistics)
SELECT * FROM Orders WHERE CustomerId = @Id
OPTION (OPTIMIZE FOR UNKNOWN);
— Force recompile on every execution (no caching)
SELECT * FROM Orders WHERE CustomerId = @Id
OPTION (RECOMPILE);
Influence Plans in PostgreSQL
PostgreSQL does not have a direct plan-forcing mechanism comparable to SQL Server’s Query Store, but you can influence plan choices through configuration parameters set at the session level, or by using the pg_hint_plan extension.
sql
— Disable nested loop joins for a session
SET enable_nestloop = off;
— Using pg_hint_plan (if installed)
/*+ HashJoin(orders customers) SeqScan(orders) */
SELECT o.*, c.CompanyName
FROM Orders o
JOIN Customers c ON o.CustomerId = c.CustomerId;
Address Skewed Data with Filtered Statistics
When a column has highly skewed values — a status column with 99% of rows in one state, for instance — standard statistics may give the optimiser a poor picture. In SQL Server, filtered statistics covering specific value ranges can dramatically improve estimates for queries filtering on those values.
sql
— Filtered statistics for a skewed status column
CREATE STATISTICS stats_orders_pending
ON dbo.Orders (Status, OrderDate)
WHERE Status = ‘Pending’
WITH FULLSCAN;
A Comparison of Common Causes and Solutions
Cause
Typical Symptom
Recommended Remedy
Stale statistics
Slowness after large data loads or batch jobs
Update statistics with FULLSCAN; schedule more frequent updates
Parameter sniffing
Intermittent slowness; fast for some users, slow for others
OPTION (RECOMPILE) or OPTIMIZE FOR UNKNOWN; local variable trick
Plan cache eviction
Slowness under high memory pressure
Investigate memory configuration; pin critical plans via Query Store
Engine upgrade / patch
Regression immediately following maintenance window
Pin compatibility level; use Query Store to force good plans
Index changes
New or dropped index causes plan invalidation
Test index changes in staging; monitor via Query Store post-deployment
Data skew
Good plan for most values; terrible for one specific value
Filtered statistics; OPTION (RECOMPILE) for affected queries
Prevention: Building a Plan-Stable Environment
Reactive diagnosis is important, but the real goal is to build an environment where plan regressions are caught before they reach production users.
Maintain Realistic Statistics in All Environments
One of the most common reasons a regression is not caught in testing is that the development or staging database has wildly different data volumes and distributions from production. A query that the optimiser evaluates against 50,000 rows will often receive a completely different plan than the same query against 50 million rows. Keeping non-production environments seeded with representative data — or at the very least, representative statistics — dramatically improves the fidelity of pre-production testing.
Enable and Review the Query Store Routinely
Enable Query Store in every production database and configure it to retain data for at least 30 days. Schedule a weekly review of the “Regressed Queries” and “Overall Resource Consumption” reports. Catching a regression when it affects one user is far less painful than catching it when it has been silently degrading performance for a fortnight.
Automate Statistics Maintenance
The default auto-update thresholds are too coarse for most production workloads. Use a maintenance solution such as Ola Hallengren’s SQL Server Maintenance Solution or a custom PostgreSQL cron job to update statistics more frequently on your most active tables, with higher sampling rates for large, skewed tables. For PostgreSQL, consider tuning autovacuum_analyze_scale_factor down to something like 0.01 or even 0.005 for tables that change frequently.
Test Schema and Index Changes with Query Capture
Before deploying any index change to production, capture the execution plans of your most critical queries in staging both before and after the change. Comparing those plans side by side takes ten minutes and can save hours of incident response. Tools like SQL Server’s Database Experimentation Assistant (DEA) automate this comparison at scale.
Use Adaptive Query Processing Where Available
SQL Server 2017 and later include Adaptive Query Processing features — including Adaptive Joins and Memory Grant Feedback — that allow the engine to correct certain plan mistakes at runtime rather than committing to a single strategy upfront. These are enabled by default at compatibility level 140 and above. Enabling the Intelligent Query Processing features in SQL Server 2019 (compatibility level 150) takes this further still.
Closing Thoughts
Query plan instability is not a sign that something is fundamentally broken — it is an inherent consequence of how cost-based optimisers work. They are making the best decisions they can with imperfect information, and when that information changes, their decisions change. The database engine is not being capricious; it is doing exactly what it was designed to do.
The teams that handle this well are not the ones who avoid plan changes entirely — that is neither practical nor desirable. They are the ones who have invested in the observability infrastructure to notice plan changes quickly, the diagnostic skills to understand why a change happened, and the tooling knowledge to respond effectively when a regression causes harm.
If there is a single habit to adopt from this article, let it be this: enable the Query Store, review it regularly, and treat plan regressions as first-class operational events worthy of the same root-cause analysis as any other production incident. A database that you understand is a database you can defend.
Related Posts
How to Migrate from Oracle to PostgreSQL: A Step-by-Step Guide